Long-Term Index March 2018*
- March 2018 : too cold, a bit too dry with average sunshine duration and no significant storm fronts
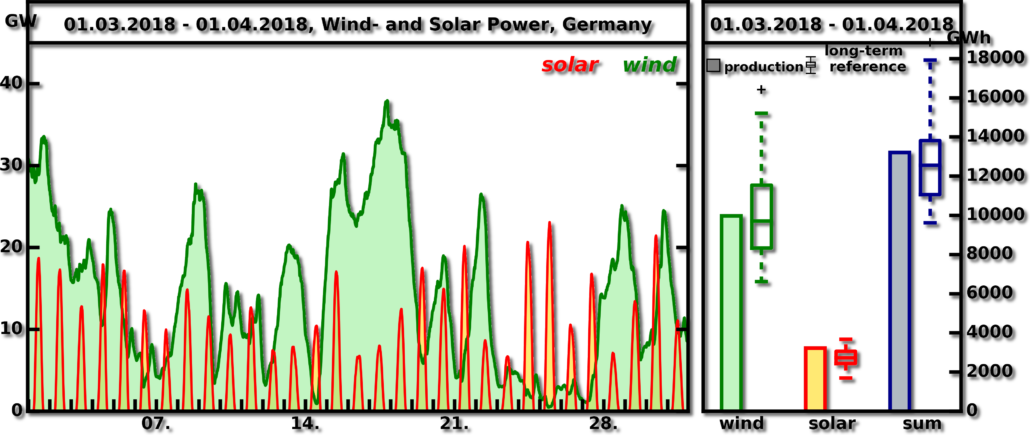
- Total solar and wind power production rank: 18 with 13,002 GWh
- Solar power rank: 24 with 2,631 GWh; wind power rank: 17 with 10,371 GWh
March 2018 was only temporarily spring-like. The first decade was dominated by dry-cold high-pressure areas while low-pressure areas with humid air dominated the weather activity towards the end. In the northeast was deep winter weather with striking snowfalls. The sunshine duration was average throughout Germany; significant storm fronts couldn’t be recorded.
Last March was in terms of solar power generation with 2,631 nearly at the average of the past 40 months. The largest energy amount could have been generated with the currently installed capacity in March 2011 with 3,669 GWh. Most often the sun shone from the south of Saxony-Anhalt over the Land of Leipzig to Lusatia and from the northern Harz foreland to the Mecklenburg Lake District and the Uckermark. Meteorologists recorded a sunshine duration of 130 to 140 hours. This corresponds to 110 to 120% of the long-term average – in some cases even more. The least amount of sunshine was recorded in the region from Nordfriesland and Schleswig-Flensburg to Ostholstein. However, even there 70 to 80% of the target was reached with 70 to 80 hours. The regions with little sunshine (only 80 to 90 hours) included the strip from the Saarland to the Thuringian Forest.
Wind power production was with 10,371 GWh slightly above average on rank 17* compared to the years since 1979. The largest amount of energy could have been generated with the currently installed capacity in the year 1994 with 16,418 GWh. Wind power generation resulted up to March 20, 2018 from moderate to fresh winds with strong to stormy gusts. Beyond this day, it was only on March 28 and 29 commonly very windy. Squalls of 62 km/h or more were registered only locally in the southern half and in the east, in the west and north on 3 to 5 days, in the north of Schleswig-Holstein on 5 to 7 days. The strongest squalls were recorded in Flensburg and Olpenitz with 94 km/h and Bft. 10 on March 17.
Last March, the total amount of wind and solar power was slightly above average. March 2018 ranks 18* with 13,002 GWh. In the first place is March 1994, as the wind in comparison to photovoltaic is more significant in March. In 1994, a total of 18,831 GWh of energy production would have been possible with the currently installed capacity.
* The UBIMET long-term index compares the solar and wind energy production yields. The UBIMET experts calculate the respective yields for each month of the last 39 years and compare them to the current values. Every yield ist related to the current German portfolio so that the periods can be compared.


Long-Term Index March 2018
Substantial feed-in management in January 2018
Long-term Index January 2018